It has become an annual tradition here at Abnormal Returns to make a big stinking deal out of the release of the latest edition of the Credit Suisse Global Investment Yearbook. See posts from 2017, 2016, 2015, 2014, 2013 and 2012. This year is a little bit different, however.
For those of you not aware the authors of this document are also the authors of the well-received Triumph of the Optimists: 101 Years of Global Investment Returns. So the 2018 Credit Suisse Global Investment Yearbook is like an updated, but abbreviated, version of the book. For example all of the long-run asset return charts and tables are updated through year-end 2017.
I just wanted to highlight a couple of charts from the 2018 Credit Suisse Global Investment. The first chart is interesting because it shows that emerging markets have over the long run NOT outperformed developed markets. Some of that is definitional, but the big thing is that WWII devastates the returns of emerging relative to developed.
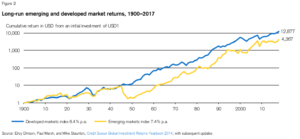
Source: Credit Suisse
In addition to the section on long run asset returns there are also sections on risk premia, factor investing and new this year a look at the investments of ultra-high net worth individuals. Below is a chart that shows a breakdown of the net worth of the global elite.
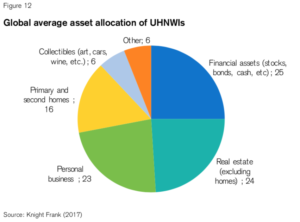
Source: Credit Suisse
Suffice it to say there is a lot more in the document. It is well-worth checking out, as usual.


