When done correct value investors can win in a number of ways.  So long as you have done your analysis correctly and the stock is truly undervalued there are a number of ways in which that value gap can close.  The biggest risk in that situation is dead money.  Last month we highlighted CVS in a screencast noting it was likely undervalued with a potential upside catalyst.  A month later the stock is higher based largely on news that activists are agitating for a spin-off of the company’s pharmacy benefits manager.  In short, he stock is higher for reasons unrelated to the original hypothesis.  In today’s screencast a review of stock catalysts.

Items mentioned in the above screencast:

Breakup values point to a higher price for CVS shares.  (Bloomberg)

A catalyst for CVS.  (AR Screencast)

Walgreens (WAG) to sell its PBM unit.  (WSJ)

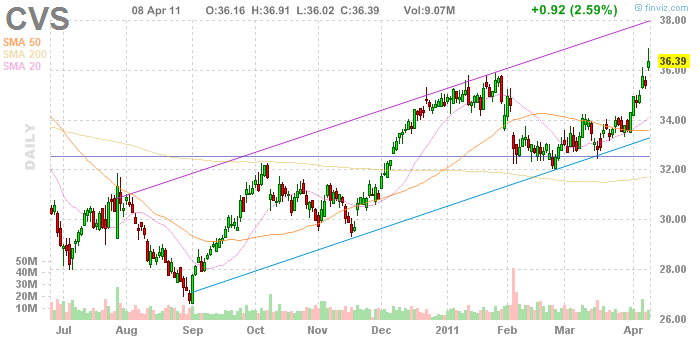
A daily price chart of CVS (CVS).  (Finviz)

Update:  CVS also catches an analyst upgrade.  (Barron’s)

This content, which contains security-related opinions and/or information, is provided for informational purposes only and should not be relied upon in any manner as professional advice, or an endorsement of any practices, products or services. There can be no guarantees or assurances that the views expressed here will be applicable for any particular facts or circumstances, and should not be relied upon in any manner. You should consult your own advisers as to legal, business, tax, and other related matters concerning any investment.

The commentary in this “post” (including any related blog, podcasts, videos, and social media) reflects the personal opinions, viewpoints, and analyses of the Ritholtz Wealth Management employees providing such comments, and should not be regarded the views of Ritholtz Wealth Management LLC. or its respective affiliates or as a description of advisory services provided by Ritholtz Wealth Management or performance returns of any Ritholtz Wealth Management Investments client.

References to any securities or digital assets, or performance data, are for illustrative purposes only and do not constitute an investment recommendation or offer to provide investment advisory services. Charts and graphs provided within are for informational purposes solely and should not be relied upon when making any investment decision. Past performance is not indicative of future results. The content speaks only as of the date indicated. Any projections, estimates, forecasts, targets, prospects, and/or opinions expressed in these materials are subject to change without notice and may differ or be contrary to opinions expressed by others.

Please see disclosures here.

Please see the Terms & Conditions page for a full disclaimer.