If you are a market geek then you need to check out the Credit Suisse Global Investment Returns Yearbook 2011.  The yearbook is driven by data compiled by Dimson, Marsh and Staunton who are well known for their work in analyzing long market return time series.

Mebane Faber at World Beta has a couple of posts up today that highlight some data from the report.  The first being a post that highlights the power of dividend yield on country selection.  The second shows the real drawdowns investors would have experienced in US (and UK) equities and bonds since 1900.

We were drawn to these charts because they highlight two themes we have harped on previously.  The first is that dividends matter.  The second is that stocks and bonds are likely riskier than most investors believe.  One thing that mitigated these market drawdowns not surprisingly turned out be diversification.
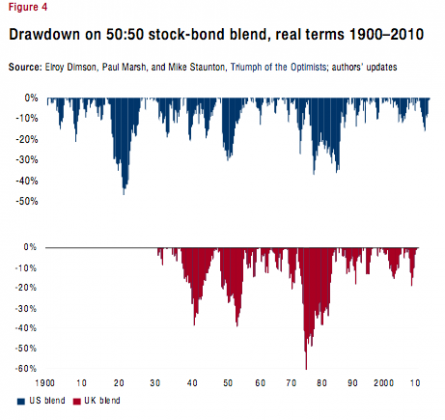
Source:  Credit Suisse Global Investment Yearbook 2011, p. 7

In any event the whole thing is worth checking out including the return analysis of nearly twenty countries.

This content, which contains security-related opinions and/or information, is provided for informational purposes only and should not be relied upon in any manner as professional advice, or an endorsement of any practices, products or services. There can be no guarantees or assurances that the views expressed here will be applicable for any particular facts or circumstances, and should not be relied upon in any manner. You should consult your own advisers as to legal, business, tax, and other related matters concerning any investment.

The commentary in this “post” (including any related blog, podcasts, videos, and social media) reflects the personal opinions, viewpoints, and analyses of the Ritholtz Wealth Management employees providing such comments, and should not be regarded the views of Ritholtz Wealth Management LLC. or its respective affiliates or as a description of advisory services provided by Ritholtz Wealth Management or performance returns of any Ritholtz Wealth Management Investments client.

References to any securities or digital assets, or performance data, are for illustrative purposes only and do not constitute an investment recommendation or offer to provide investment advisory services. Charts and graphs provided within are for informational purposes solely and should not be relied upon when making any investment decision. Past performance is not indicative of future results. The content speaks only as of the date indicated. Any projections, estimates, forecasts, targets, prospects, and/or opinions expressed in these materials are subject to change without notice and may differ or be contrary to opinions expressed by others.

Please see disclosures here.

Please see the Terms & Conditions page for a full disclaimer.