Earlier this week we had a two-part Q&A with Wes Gray, one of the co-authors of Quantitative Value: A Practitioner’s Guide to Automating Intelligent Investment and Eliminating Behavioral Errors. Today we have a chance to pick the brain of the other co-author Tobias Carlisle who has a new book out Deep Value: Why Activist Investors and Other Contrarians Battle for Control of Losing Corporations.
You may also know Toby’s work at his blog Greenbackd. The book is timely because it looks at the history of activist investors who we note below are currently the toast of the hedge fund crowd. Toby was kind enough to answer some questions about his book and the state of value investing at present. Our questions appear in bold, Toby’s answers follow.
———-
Activist investing is all the rage today. However you correctly note that activists, like Carl Icahn, have been at it for quite some time. What has led to the rise of activists of late?
Wall Street can be faddish. Like conglomerates in the 1960s, leveraged buy-outs in the 1980s, and venture capital in the 1990s, activism exploded in the early 2000s on the back of the success of a new breed of investors that included Edward Lampert, William Ackman, Daniel Loeb and David Einhorn. Activism, which is primarily driven by deep undervaluation, tends to be counter-cyclical, ebbing and flowing with equity valuations. In the wake of the dot-com bust in the early 2000s, there were a number who got started chasing the cashed-up failures of the information technology and communications boom. For the most part, those were the same guys who continued plying their trade through the 2009 low. The research shows that, in addition to undervaluation, activists seek cash-rich balance sheets, and over-diversified businesses, both of which are symptoms of the tension between managers who want larger fiefdoms, and shareholders who prefer that cash be distributed out to them when returns drop below a threshold. Looking at listed companies in the US now, following the rise in equity valuations and borrowing for buybacks, it would be hard to characterize the average stock as undervalued, or cash rich. More likely they are overvalued, and indebted. Brett Arends noted in an August 4 article for Marketwatch that U.S. non-financial corporations are carrying debts equal to 50 percent of their actual net worth, and that is “near record levels, and far above historic averages:”
In 1950 companies barely owed 20% of their net worth. In the early 1980s it was a little over 25%. Even in 2007 it was below 40%.
And this, note, is after years of record profits. Companies have used their profits, and their borrowings, to drive up their own stock prices.
Activists may be partly to blame, but mostly it’s due to very low interest rates and very high equity valuations, which are two sides of the same coin. The activist opportunity set is always going to be best at market lows: It was excellent in the early 2000s, and very good in 2009. Now it is poor. A correction in the market will improve the opportunity set because it will ameliorate one part of the problem, overvaluation, but we won’t see the systemic overcapitalization that we saw in the early 2000s. We are probably close to peak activism for this cycle, if we haven’t passed it already.
There are a number of references in the book of investors, or their analysts, manually combing through S&P tearsheets looking for candidates. How has the emergence of cheap and powerful databases and analytical tools changed value investing?
Logically, the simplest answer is that it must lead to a reduction in the number of mispriced opportunities, which is the value investor’s bread-and-butter. That will push value investors into special situations that don’t screen easily or at all. Empirically, it’s difficult to separate the cyclical drivers of mispricings–like plain, old stock market overvaluation–from the secular ones, like better, cheaper screening technology. Millennial Investor Patrick O’Shaughnessy shared the following chart that shows the proportion of non-financial U.S. companies with an inflation-adjusted market capitalization of at least $200 million trading on an enterprise multiple (EV/EBITDA) of less than 5, what I would characterize as deeply undervalued.
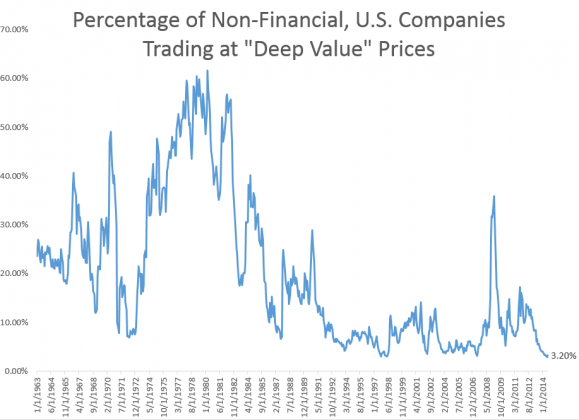
Source: Patrick O’Shaughnessy, Searching for Deep Value Stocks, September 15, 2014
In mid-September just 3.2 percent of all stocks qualified as deeply undervalued, up slightly from the all-time low of 2.9 percent of all stocks reached in June this year. Whether it’s due to cyclical stock market overvaluation or better screening technology or some combination of both, I can’t say.
The counterpoint to this argument is that value investing is simple, but it’s not easy. It’s simple to understand, but behaviorally difficult to do. Though we know statistically that undervalued stocks with fundamental weakness outperform, it’s hard to buy falling stocks, and even more so when they have fundamental weakness. Screeners can help find good opportunities, but they can’t help buy them. To the extent that investors continue to be humans making cognitive errors, the opportunity will persist.
I get that sense from the book that anyone interested in value investing should first master the concept of net-nets. Even though true net-nets are rare these days is it still worthy studying?
Net nets are a good starting point because, through investing in them, we can learn about the relationship of price to intrinsic value, the importance of a margin of safety, and, more generally, financial statement analysis. They are simple to analyze because they are purely quantitative, and, as a group, perform well, so they are worthy of study. They also teach that poor fundamental business performance does not necessarily lead to poor stock market returns, and vice versa. Mispricings are more important.
On a related note your write about the often ugly characteristics of stocks selected for a contrarian value strategy. Is this why it is important to use statistical models to build these types of portfolios?
Yes. Most deeply undervalued, fundamentally weak stocks are that way because their futures appear uncertain—they are losing money or marginally profitable—and, on an individual basis, don’t appear to be good candidates to buy. We know, however, that in aggregate they provide excellent returns, outperforming the market in the long run and suffering fewer down years than the market. This is an area in which our native intuition fails us. No matter how well trained we are, we tend to have difficulty with probabilistic, uncertain, and random processes. So the question becomes, “How can we trick or force ourselves to fill the portfolio with the right stock?”
Since the 1950s, social scientists have been comparing the predictive abilities of traditional experts, and what are known as “statistical prediction rules,” which are just simple models. The studies have found almost uniformly that that statistical prediction rules are more consistently accurate than the very best experts. This observation is now so well-accepted as to be known as The Golden Rule of Predictive Modeling. So why don’t we apply it to investment?
The reason is that most investors, like most experts in other fields, believe that it would be better to use the output from the statistical prediction rule, and retain the discretion to follow the rule’s output or not. There is some evidence to support this possibility. Traditional experts are shown to make better decisions when they are provided with the results of statistical prediction. The issue is that they continue to underperform the statistical prediction rule alone. The reason is known as the “broken leg” problem:
Suppose an actuarial formula accurately predicts an individual’s weekly movie attendance. If we know that the subject has a broken leg, it would be wise to discard the actuarial formula.
Statistical prediction rules get broken-leg problems incorrect because the particular case is so different from the base rate. If that is so, goes the argument, then surely these anomalous cases could benefit from an expert overriding the rule? The studies find that they do not. In fact, experts predict less reliably than they would have if they had just used the statistical prediction rule. The reason is that when experts are given statistical prediction rules along with permission to override them, the experts find more broken legs than there really are.
The contrarian value investment strategy is a good avenue for the application of statistical-prediction rules because all of the stocks have what appear to be broken legs. The intrinsic value in these stocks is uncertain because its discovery requires the anticipation of an event not obvious in the historical financial data—mean reversion. Rather we must rely on the statistical base case for undervalued, money-losing securities—that they will spontaneously mean revert toward a state of earning power commensurate with their assets.
The evidence is very strong that value (vs. glamour) works pretty consistently across time and markets. Can we chalk this up to “persistent cognitive errors” or is there something else going on?
Value investing works because it is about getting more value than you give up. But that begs the question, “Why doesn’t everyone just buy undervalued stocks, and pass on, or short, the overvalued, glamour stocks?” And the answer is that undervalued stocks tend to behaviorally difficult to buy, and glamour stocks appear attractive.
In Contrarian Investment, Extrapolation and Risk (1994), Lakonishok, Shleifer and Vishny demonstrate that value strategies outperform because they are “contrarian to ‘naive’ strategies followed by other investors:”
These naive strategies range from extrapolating past earnings growth too far into the future, to assuming a trend in stock prices, to overreacting to good or bad news, or to simply equating a good investment with a well-run company irrespective of price.
Lakonishok et al continue that investors get overly excited about stocks that have done well in the recent past and bid them up so that these “glamour” stocks become overpriced, and overreact to stocks that have done badly, oversell them, and these out-of-favor “value” stocks become undervalued. In both cases it is a failure to appreciate the impact of mean reversion, which is a cognitive error.
In pursuit of the idea that it is a failure to incorporate mean reversion into growth forecasts, Lakonishok et al undertake a really interesting examination of the data. They looked at two portfolios of value stocks trading on comparable multiples of price-to-earnings, cash flow, operating earnings, book value and sales, but with different historical rates of sales growth; one with a high rate of growth, the other low. They find that, even in the value portfolios, stocks with lower historical rates of growth outperform stocks with higher rates of growth. And the reason is that, in both cases, the extrapolated growth rates don’t materialize. Instead the fundamentals mean revert too.
Although it seems to be petering out, has the wave of share buybacks been in part a pre-emptive reaction to activist investors? From the outside these programs have seemed to be pretty indiscriminate.
Activist investors may have had a hand in it, but buybacks tend to follow the markets: When the market is up, so are buybacks. In one of his recent commentaries, John Hussman noted that buybacks (and corporate borrowing) tend to soar along with equity markets, and the most recent run up in the market has been no different:
Notice that heavy equity buybacks (negative values on the red line below) are regularly financed by the issuance of corporate debt (a mirror image of positive values on the black line). Those debt-financed equity buybacks have been heaviest at market peaks like 1999-2000, 2007, and today. Put simply, the history of corporate stock buybacks is a chronicle of corporations buying stock with borrowed money at market tops, and retreating from buybacks at the very points that stocks are most reasonably valued.
He shared the chart below to illustrate his point:
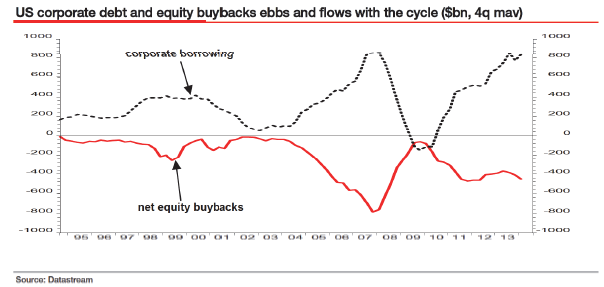
Source: John Hussman, The Two Pillars of Full-Cycle Investing, September 8, 2014
In my book I wrote about there being two lenses through which we can view financial markets: mean-reversion (or value) and momentum. Momentum research seems in vogue these days. Most investors, by temperament, fall into one of the two camps. Should investors diversify their strategic risk into complementary strategies or should they stick to their guns?
The research from James O’Shaughnessy at OSAM and Cliff Asness at AQR is clear that diversifying across value and momentum strategies leads to better returns because each works at different times. I execute a bottom-up, fundamental deep value investment strategy in a systematic way, but I don’t include any momentum in my analysis. The reason is that I’m a former corporate lawyer turned fundamental deep value investor, wary of behavioral biases, but not a quant seeking factors or anomalies. That might sound limited, but I don’t think you need to be all things to all men as a manager, you just need to know where the limits of your expertise lie. I don’t think an investor needs to do everything either. Find a strategy that suits your personality so you can persist with it when it underperforms. That’s the key to long-term outperformance.
———-
Thanks to Toby for taking the time to answer our questions and good luck with the book.


