Last year I got all excited when Credit Suisse released its annual global investment returns yearbook. In part, because I used some of the data in an earlier version of that publication to help me write my own book.  Well it is that time of year again and the new Credit Suisse Global Investment Returns Yearbook 2013 is now out. Dimson, Marsh and Staunton the authors of the yearbook are also the authors of the much cited Triumph of the Optimists: 101 Years of Global Investment Returns.

In addition to their annual look at returns across a number of countries and time frames the authors take an in-depth look at three topics:

  1. The stresses and challenges of a low-return world;
  2. The evidence for mean-reversion in equity returns and
  3. Is inflation good for equities.

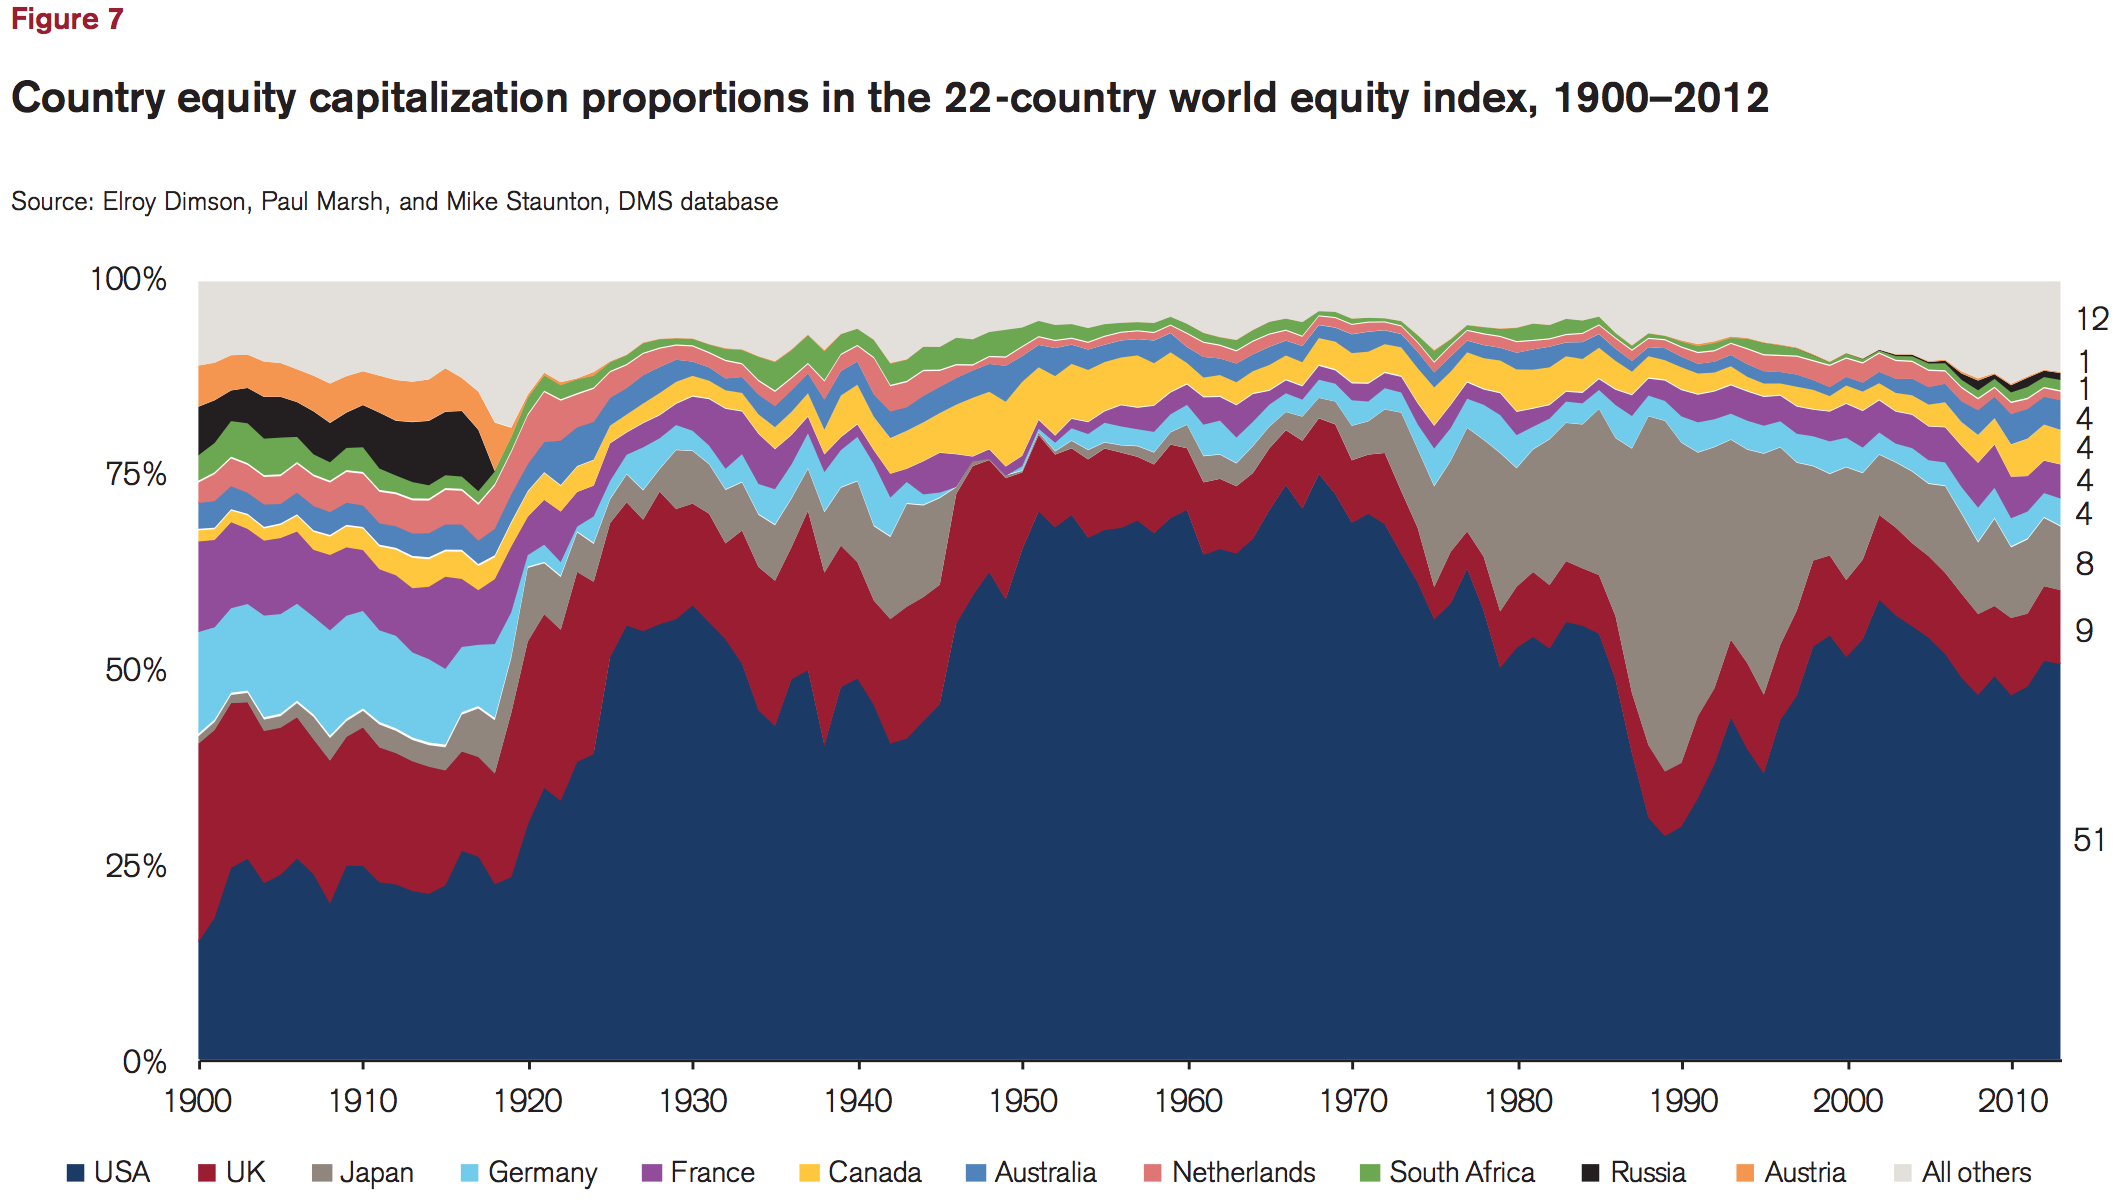
There is a number of great charts in the document but I thought this chart presents a great deal of information on the global equity market all in one big graph.

EquityCap_0213

As I wrote last year:

In short, this document is a must-read. Sell-side research comes in for a lot of criticism of late from all corners of the blogosphere. However a document like this shows that there still is some great research being produced. And the price is right. You can thank me later for the recommendation….

Some other posts that mention the yearbook:

Low yields, mean reversion focus of 2013 Credit Suisse Global Investment Yearbook 2013. (Investment Europe)

Investors can expect low returns for 20 to 30 years.  (Pensions & Investments)

My #1 read of the year.  (The Idea Farm)

Why market timing doesn’t work.  (The Source)

This content, which contains security-related opinions and/or information, is provided for informational purposes only and should not be relied upon in any manner as professional advice, or an endorsement of any practices, products or services. There can be no guarantees or assurances that the views expressed here will be applicable for any particular facts or circumstances, and should not be relied upon in any manner. You should consult your own advisers as to legal, business, tax, and other related matters concerning any investment.

The commentary in this “post” (including any related blog, podcasts, videos, and social media) reflects the personal opinions, viewpoints, and analyses of the Ritholtz Wealth Management employees providing such comments, and should not be regarded the views of Ritholtz Wealth Management LLC. or its respective affiliates or as a description of advisory services provided by Ritholtz Wealth Management or performance returns of any Ritholtz Wealth Management Investments client.

References to any securities or digital assets, or performance data, are for illustrative purposes only and do not constitute an investment recommendation or offer to provide investment advisory services. Charts and graphs provided within are for informational purposes solely and should not be relied upon when making any investment decision. Past performance is not indicative of future results. The content speaks only as of the date indicated. Any projections, estimates, forecasts, targets, prospects, and/or opinions expressed in these materials are subject to change without notice and may differ or be contrary to opinions expressed by others.

Please see disclosures here.

Please see the Terms & Conditions page for a full disclaimer.