Today marks the 121st anniversary of the Dow Jones Industrial Average. Barry Ritholtz at the Big Picture correctly points out the many issues with index itself. That being said one of the great things about the Dow is you can use it to look back at the many events through history that has affected the stock market.
The histogram below, from Andrew Dickson at Albert Bridge Capital goes all the way back to 1896.* It shows the performance of the Dow on an annual, decade and two-decade basis. One thing worth noting is how bad the performance of the Dow was from 2000-2009 and how well it has performed from 2010-2017.
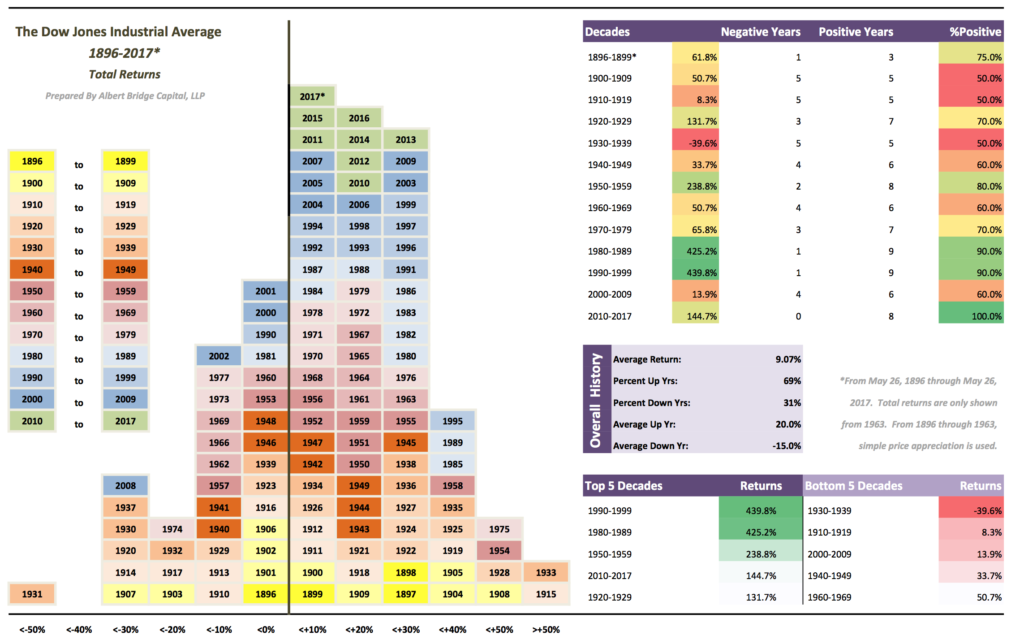
Source: Albert Bridge Capital
Despite its shortfalls the Dow isn’t going anywhere. (In part because there is $15 billion in AUM in an ETF tracking it.) To paraphrase Humphrey Bogart, “We’ll always have the Dow.”
*This post was updated on May 29th with a graphic going back to 1896.


