This week FinTwit, the investment blogosphere and financial media all went bat-blank crazy about the inversion of the yield curve. We even put a post about it here on the site. This is another example of us wanting to try and forecast the future using an indicator which has a pretty good track record. The question is whether this is time well spent. I would argue that that there is other data which is far more interesting: demographics.
Did you know that world fertility rates have declined 50% over the past fifty years? That is a remarkable statement that has wide-ranging effects. You can this visualized below.
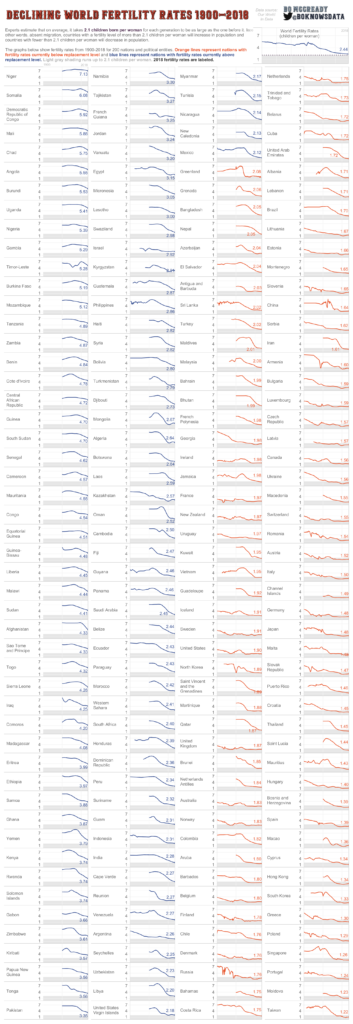
source: Visual Capitalist
You can see that in many developed countries, the fertility rate is already well below replacement rates. Countries like Taiwan, Portugal, Poland and South Korea are set to shrink absent meaningful immigration.
That does not mean that total world population will shrink any time soon. You can see below that given current trend world population will continue growing through the end of the century.
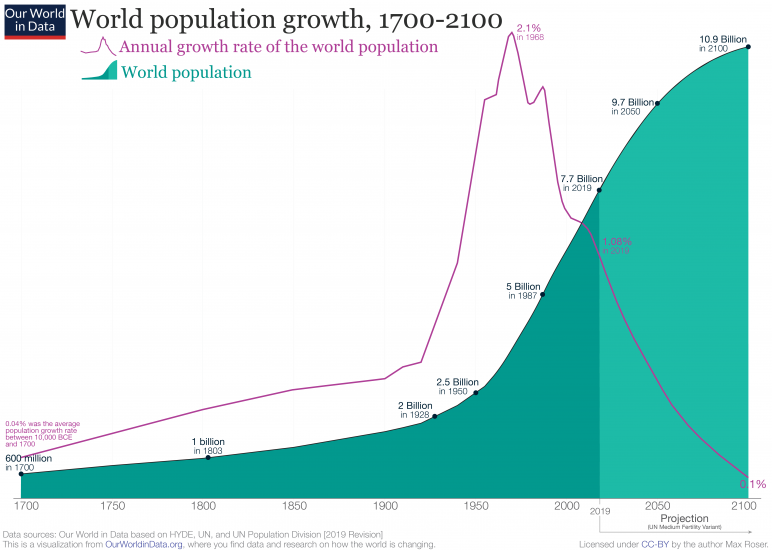
source: Our World in Data
But in certain countries this will have a big effect. According to these projections China’s population will soon stop growing and begin declining by 2035. India’s day of reckoning is a few decades down the road, which by that time it will be the world’s most populous nation, but it is on the chart.
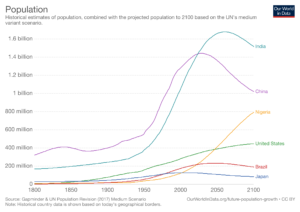
source: Our World in Data
Demographics isn’t destiny. But it is hard to argue that it doesn’t have big economic, social and political effects. It likely isn’t a coincidence that Europe and Japan, which are both in demographic deficits, have some of the lowest interest rates in the world.
Ruchir Sharma in the New York Times has a piece that urges us to reset our expectations about what strong economic growth looks like in this new world. In a world where working age populations are shrinking:
To avoid overreacting, the discussion about economic health needs to shift to measures that better capture satisfaction and contentment, like per capita income growth. In countries with shrinking populations, per capita incomes can continue to grow so long as the economy is shrinking less rapidly than the population.
In short, we need to reset our expectations around economic growth, unemployment and interest rates. Demographics don’t turn on a dime so we need to think different. Sharma writes:
The benchmark for rapid growth should come down to 5 percent for emerging countries, to between and 3 and 4 percent for middle-income countries like China, and to between 1 and 2 percent for developed economies like the United States, Germany and Japan. And that should just be the start to how economists and investors redefine economic success.
In school, a lot of classes grade on the curve. The global economic growth curve has shifted. It’s time to catch up to reality.
*Just saw this Zachary Karabell piece on the “global population bust” in Foreign Affairs.


