A surprise interest rate cut by China’s central bank has stock market futures running higher this morning. Before the market opens and things get crazy I wanted to check in on an interesting market indicator. See here a much earlier edition.
Morningstar publishes a “market fair value” graph. Here is how Morningstar describes it:
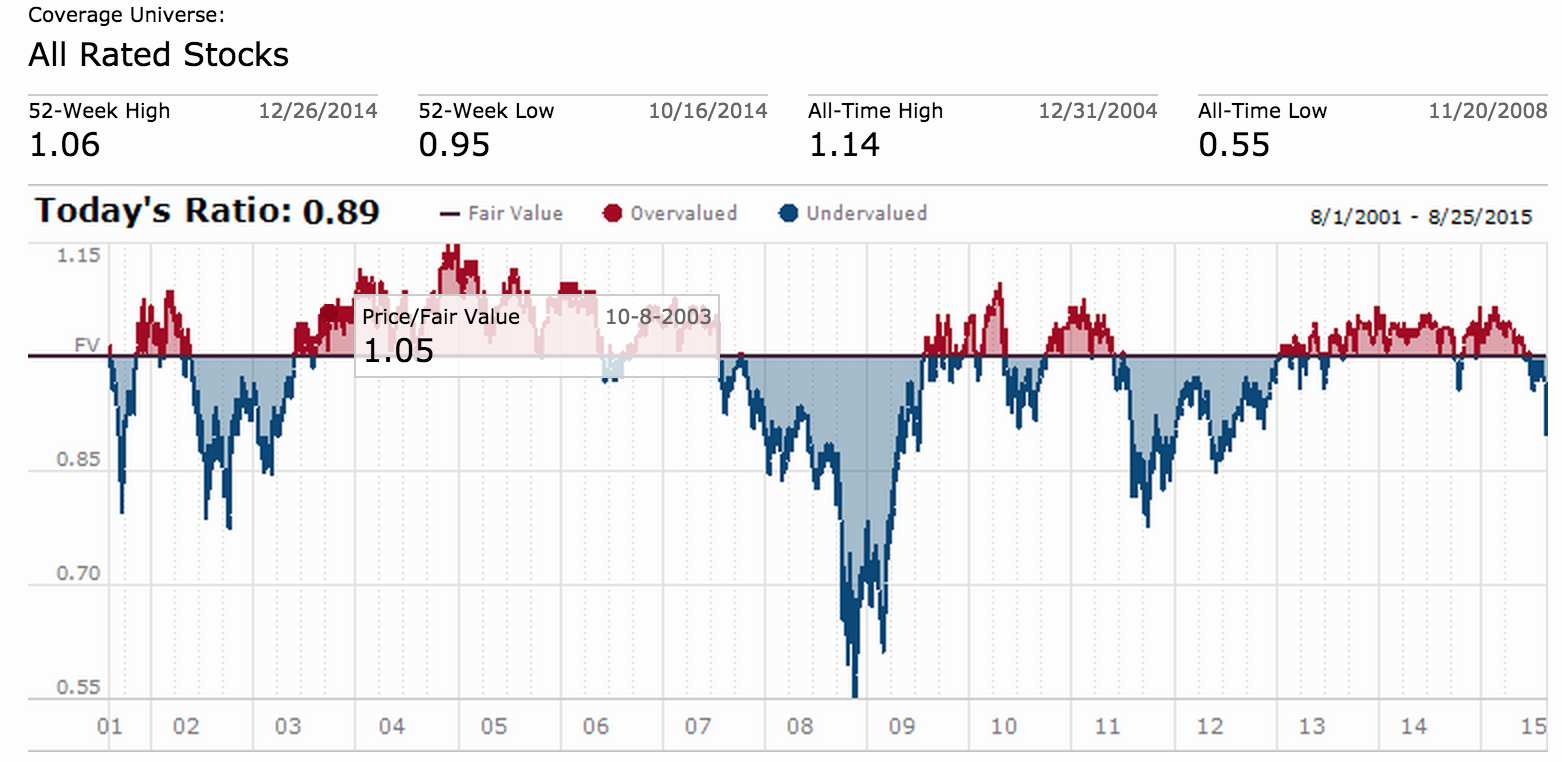
Is the market cheap or expensive? The chart above tells the story based on Morningstar’s fair value estimates for individual stock. The graph shows the ratio price to fair value for the median stock in the selected coverage universe over time.
So what is it saying now (before the open)? In short, it says that the market went from being moderately overvalued this Summer to moderately undervalued. We are back to levels seen in 2011-2012. We are nowhere the levels back in 2008-2009 when the stock market was severely undervalued.
Source: Morningstar
Today’s open aside, the market has given investors an opportunity. Those of you who felt like they missed the 2011-2015 leg of the bull market you now have another bite at the apple. That being said you have to be willing to take one some losses in the mean time. 2002, 2008-2009 and 2011 all show that the stock market can go a lot lower before it goes higher.


