It has become an annual tradition here at Abnormal Returns to make a big stinking deal out of the release of the 2017 edition of the Credit Suisse Global Investment Yearbook. See posts from 2016, 2015, 2014, 2013 and 2012. This year is a little bit different, however.
Credit Suisse is only publishing a summary edition of the yearbook online, for free. CS customers can get the full version, of course. That dampens our enthusiasm somewhat, but the yearbook is still a treasure trove of data for investors both novice and experienced.
I just wanted to highlight a couple of charts from the 2017 Credit Suisse Global Investment Yearbook. The first shows the dramatic change in industry composition of both the US and UK markets over the past century (or more). This insight is important because it highlights the challenges in comparing valuations across long periods of time. In short, the market today is very different than it was at the turn of the 20th century.
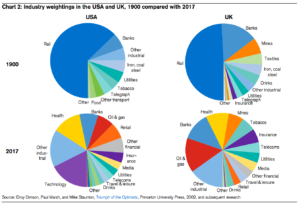
Source: Credit Suisse
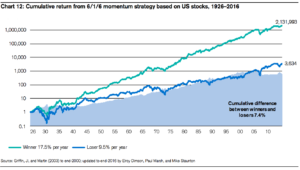
Dimson, Staunton Marsh also dive into the factor investing debate. They focus on five factors, size, value, volatility and momentum, that seem to stand out in the long-term data. They use data to ask the question: “Are factor risk premiums simply transitory anomalies in stock-market behavior that, no sooner have they been identified, swiftly disappear?” Below you can see a graph showing the strong performance of momentum over time.